The population for this analysis was derived from the Intex and encompasses the following types of underlying collateral: Subprime, Alt-A, Option-ARM and Scratch and Dent. The dataset was further divided into six semi-annual periods based on the deals’ closing date.
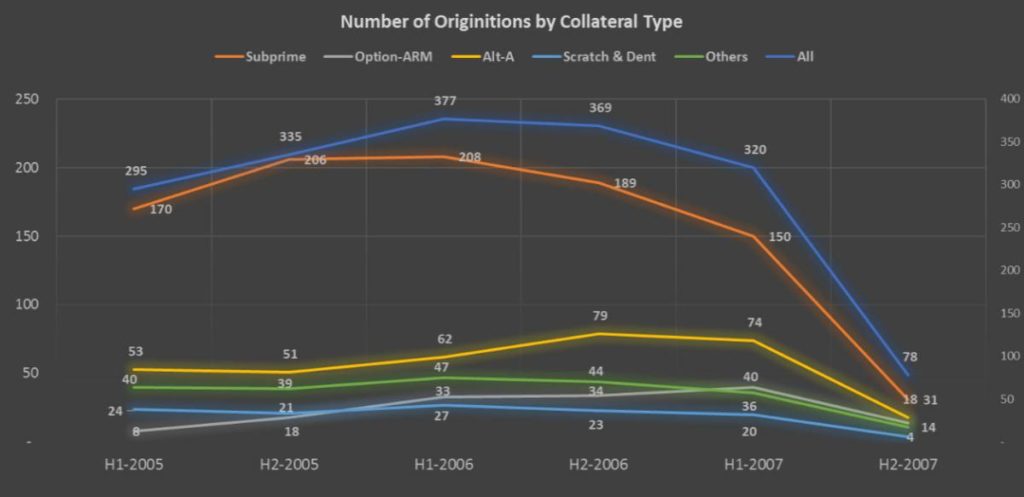
Overall issuance for these deal types peaked in the first half of 2006, led consistently by subprime issuance (Table 1: Origination # by period). Prior to 2007, subprime issuance exceeded 50% of the overall issuance. Beginning in late 2006 and throughout 2007, issuance volume for Option-ARM and Alt-A began to increase. However, in the second half of 2007, the overall issuance volume decreased by more than 75% from the first half of 2007.
Table 1: # of deals issued by period
Chart 1: Origination # by period
M1 tranches from the subject population were stratified by collateral type to gain an understanding of their overall performance. The analysis concluded that M1 bonds backed by certain collateral types performed better than others.
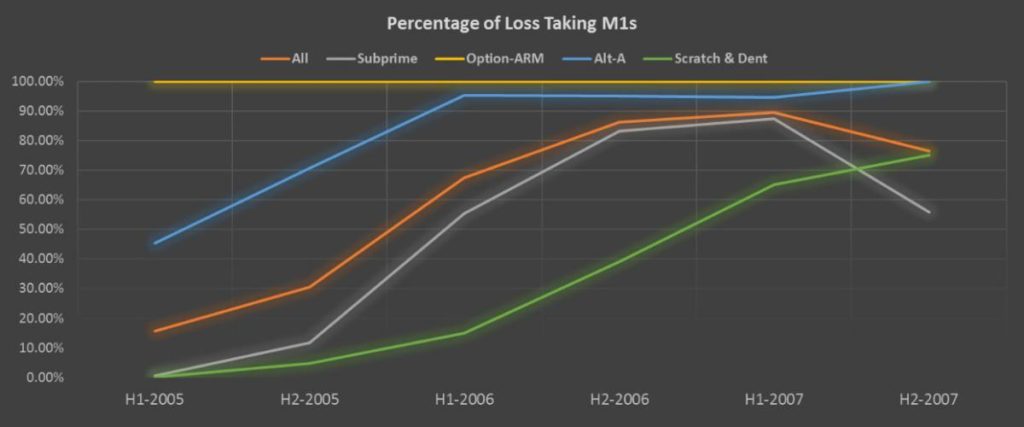
Chart 2: Percentage of loss taking M1s by issuance date
As can be seen in Chart 2, M1 tranches backed by Option-ARM collateral emerged as the worst performer, experiencing 100% loss across all issuance periods, followed by the Alt-A sector. Alt-A bonds post 2005 incurred losses greater than 90%. Performance of M1s of all collateral types deteriorated over the issuance period from H1-2005 to H2-2007 except for Subprime bonds. The performance of M1s of Subprime deals originated in H2-2007 exhibited significantly better performance than prior period issuances.
To better understand the improvement of the M1 bonds backed by subprime collateral, the population was stratified by credit enhancement levels across different issuance periods. The average credit enhancement levels for M1 tranches secured by subprime collateral started to increase in the first half of 2007. Average credit enhancement in H1-2007 increased by 8.6% from the previous period and increased by 37% in H2-2007 compared to H2-2006.
Table 3 shows a summary of the average credit enhancement for M1 Subprime deals which increased consistently for seven out of the eight periods analyzed between 2005 to 2007. The Subprime credit enhancement increased more than 50% from 2005 to 2007.
Table 3: Credit Enhancement – Subprime
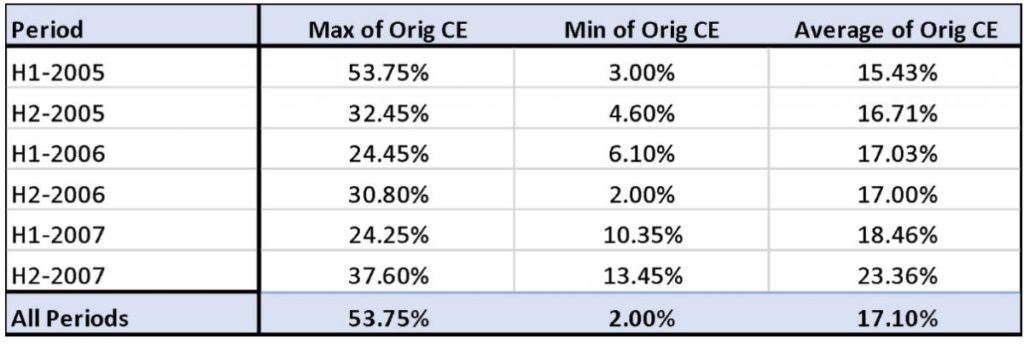
The average credit enhancement for M1s across all collateral types was stable for the H1-2005 to H1-2007 and increased slightly for H2-2007 issuance. Overall, average credit enhancement increased 18% from the first half of 2005 to the second half of 2007. The most prominent increase was experienced by the subprime sector.
Table 4: Average Credit Enhancement – All collateral types
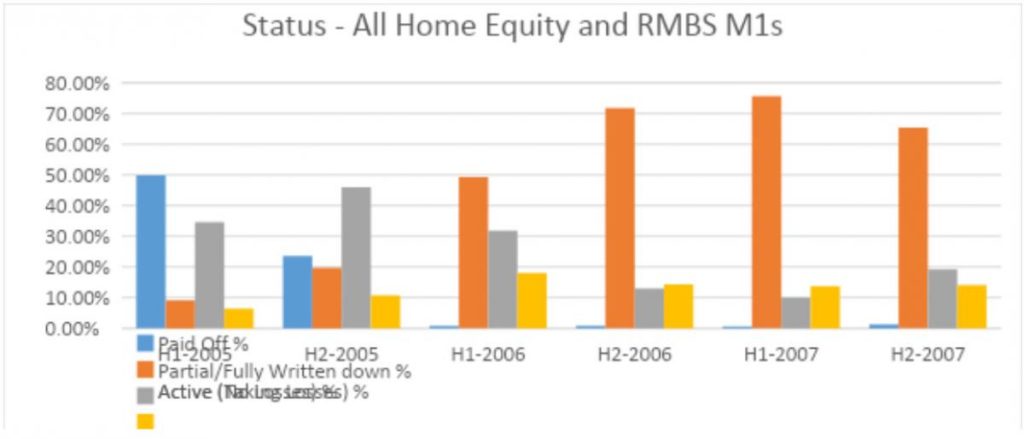
Chart 3: Status of Home Equity and RMBS M1s by Issuance
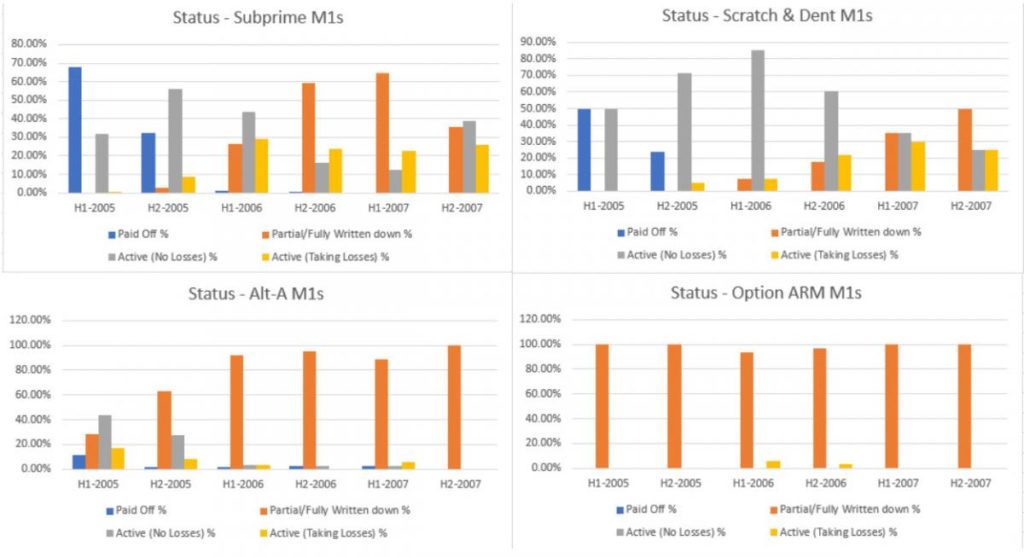
Chart 4: Status of Different Collateral Type M1s by Issuance
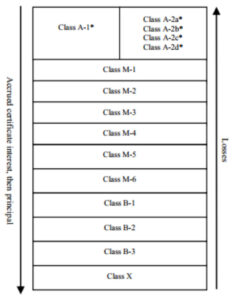
For the purpose of this analysis we assumed the M1 bond was the senior most non-senior bond. However, every trust is unique, therefore prior to investing or divesting, a detailed analysis needs to be performed to have a firm understanding of how the interest, principal, monthly excess spread, realized losses incurred and reversed.
We strongly believe that the unique position of these securities provide a compelling opportunity for sophisticated investors with the right set of analytical tools and advisors to benefit from existing or new positions.
Oakleaf at a Glance
See Who We Are | Meet Our Leadership Team
Join The Oakleaf Team
Join Oakleaf and put your talents and skills to work with our leading financial, banking, and mortgage client organizations.
See The Work We Do
See how we support our clients and their teams in tackling their most complex matters. Or contact us if you want to discuss anything further.


